Debugging
In the marimo editor
Setting breakpoints with pdb
marimo supports pdb, the Python debugger. Set breakpoints in your code using
the built-in breakpoint() function. When the code execution reaches a
breakpoint, it will pause, and you can inspect variables, step through the
code, and evaluate expressions.
Here's a live example of how to use breakpoint() in a marimo notebook cell. Type
help in the debugger for a list of commands.
The debugger blocks execution
When the debugger is active, you cannot execute cells. Remember to continue or quit the debugger to avoid hanging the notebook!
Adding breakpoints in the stack trace
Click the little bug icon in the stack trace to add breakpoints.
Clicking on the cell link will also take you to the cell where the error occurred.
Postmortem debugging
If your code raises an exception, you can use postmortem debugging to inspect the state of the program at the point where the exception occurred. Click on the "Launch debugger" button as shown below:
Debugging notebooks as scripts
Since marimo notebooks are standard Python files, you can run them as scripts from the command line. The following command will run your marimo notebook and drop you into the pdb debugger if an exception occurs, or if you hit a breakpoint.
Debugging with AI
marimo provides built-in integration with AI assistants to help you debug your notebooks.
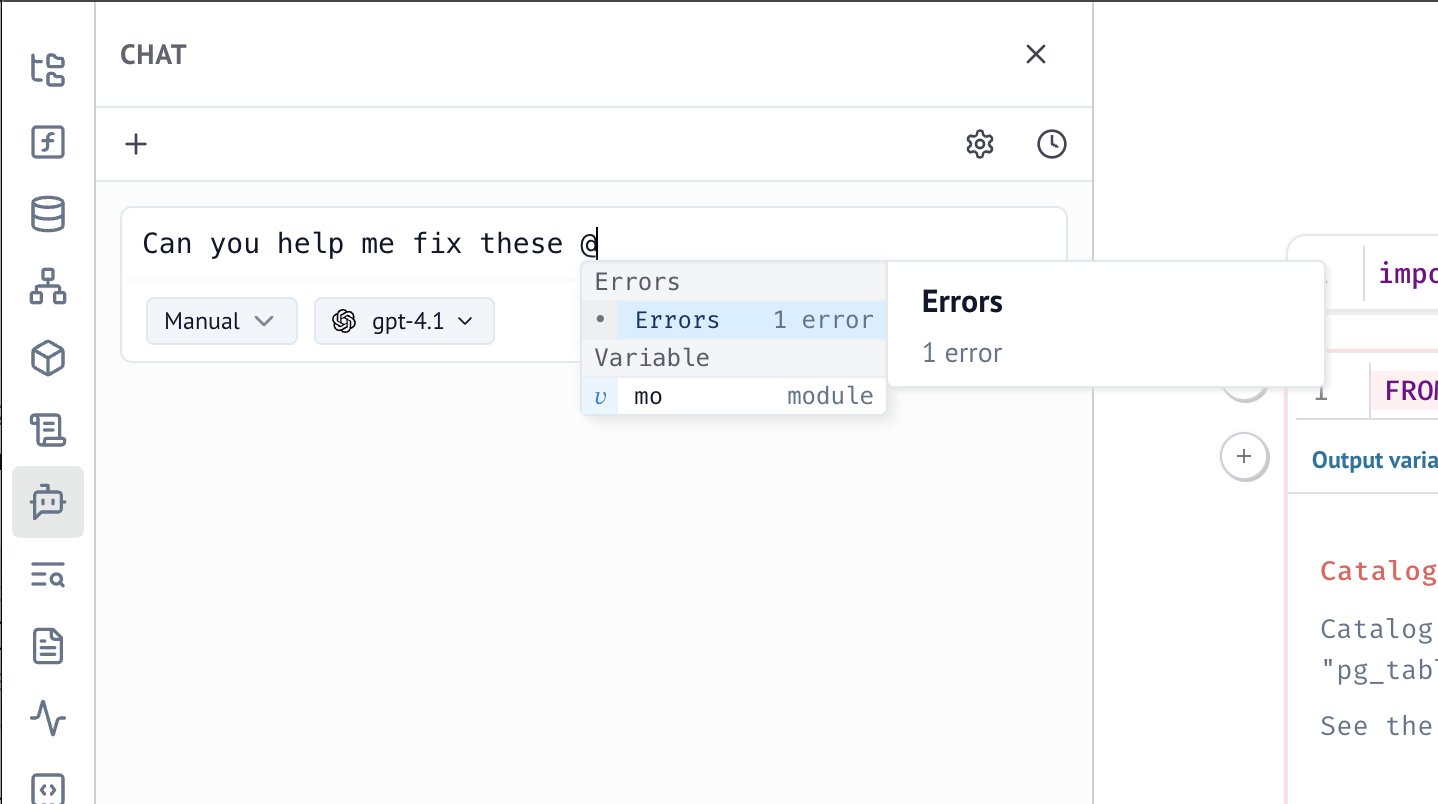
Ask about notebook errors
When interacting with the AI chat, you can reference the notebook "Errors" with
the @-symbol to bring in comprehensive error information from your notebook,
making it easier to get targeted debugging help.
Best practices for AI-assisted debugging
Provide context beyond just the error. Include information about: - What you were trying to accomplish - Recent changes you made to the notebook - Whether the error is new or recurring - Related cells that might be involved
Leverage marimo's debugging tools alongside AI. Use marimo's dataflow tools to understand cell relationships, then share this information with AI assistants for more targeted advice.
Ask specific questions. Instead of "Why is this broken?", try: - "Why might this reactivity issue be occurring between these cells?" - "How can I fix this import error in my marimo notebook?" - "What's the best way to debug this performance issue in my data processing pipeline?"
Tip
AI assistants are particularly helpful for explaining marimo-specific concepts like reactive execution, cell dependencies, and the differences between marimo notebooks and traditional Jupyter notebooks.
Integrating with external IDEs
marimo supports debugging with IDEs, like VS Code, which natively support the
debugpy library. This allows you to set breakpoints, step through code, and
inspect variables directly from your IDE.
Running as scripts
You can debug marimo notebooks in VS Code using the following launch.json.
This launch configuration will debug a marimo notebook executing it as a
script.
{
  "version": "0.2.0",
  "configurations": [
    {
      "type": "python",
      "request": "launch",
      "name": "marimo Debug: script mode",
      "program": "${file}",
      "debugOptions": [
          "--ignore", "*/site-packages/marimo/*"
      ]
    },
  ]
}
Interactive development
Edit mode debugging allows the marimo editor to trigger breakpoints set in an IDE like VS Code. Running in this mode will automatically start your notebook in watch mode. Note that the file state and editor must be consistent for break points to correctly work. If debugging is not acting as expected, force a notebook save and toggle the relevant breakpoints.
Use the following launch.json configuration to enable edit mode debugging:
{
  "version": "0.2.0",
  "configurations": [
    {
        "type": "debugpy",
        "request": "launch",
        "name": "marimo Debug: edit mode",
        "program": "${file}",
        "console": "integratedTerminal",
        "cwd": "${workspaceFolder}",
        "env": {
            "MARIMO_SCRIPT_EDIT": "1"
        },
        "justMyCode": false
    }
  ]
}
Note
This will disable marimo's internal debugging features.
Danger
This mode is blocking in VS Code, so you will need to interact with the debugger in your editor to regain control of the marimo notebook.